- The Japanese yen is trading at around 161.28 yen, its lowest level in 38 years.
- The yen’s decline may be limited as the Tankan manufacturing index rose to 13 in the second quarter, the highest level in two years.
- The US dollar has struggled as recent inflation data has raised expectations of a rate cut by the Fed in 2024.
The Japanese Yen (JPY) is trading near 161.28 yen on Monday, its lowest level since 1986. Positive data on the Japanese economy is boosting market sentiment and could propel the JPY higher. Moreover, expected speculation about an imminent intervention by Japanese authorities is supporting the JPY and limiting the upside of the USD/JPY pair.
Japan’s Bank of Japan Tankan manufacturing index rose to 13 in the second quarter from the previous 11. The index hit its highest level in two years on the back of an improving economic outlook. Meanwhile, Japan’s Jibun Bank manufacturing PMI was revised slightly downward to 50 from a preliminary June reading of 50.1, but maintained economic expansion for the second consecutive month.
The US Dollar (USD) is weakening as recent inflation data has raised expectations that the US Federal Reserve (Fed) will cut interest rates in 2024. According to the CME FedWatch tool, the likelihood of the Fed cutting interest rates by 25 basis points in December has risen to about 32.0% from 28.7% a week ago.
Daily Digest Market Trends: Japanese Yen Falls Despite Strong Economic Sentiment
- Japan’s Bank of Japan Tankan forecast for large manufacturers rose to 14 in the second quarter from 10 in the previous survey, while capital investment for all large industries rose to 11.1% in the second quarter from 4.0% in the previous survey.
- Federal Reserve Bank of San Francisco President Mary Daly said on Friday that monetary policy is working, but it’s too early to tell when it would be appropriate to cut interest rates. “If inflation stagnates or falls slowly, interest rates will need to remain higher for a longer period,” Daly said, according to Reuters.
- The Bureau of Economic Analysis reported Friday that U.S. inflation fell to its lowest annual rate in three years. The U.S. personal consumption expenditures (PCE) price index rose 2.6% year-over-year in May, down from 2.7% in April and in line with market expectations. Core PCE inflation also rose 2.6% year-over-year in May, down from 2.8% in April and in line with expectations.
- Reuters reported on Friday that Finance Minister Shunichi Suzuki said authorities were “deeply concerned” about the impact of “rapid and one-sided” currency fluctuations on the economy. Suzuki added that excessive fluctuations in the currency market were undesirable and authorities would respond appropriately to such fluctuations.
- Data released on Friday showed Tokyo’s consumer price index (CPI) inflation rose to 2.3% year-on-year in June, up from 2.2% in the previous quarter. Tokyo’s core CPI inflation, which excludes volatile food prices, also rose in the same period, rising to 2.1% year-on-year from 1.9% year-on-year, beating the median market forecast of 2.0% year-on-year.
Technical reasons: USD/JPY trading around 161.00
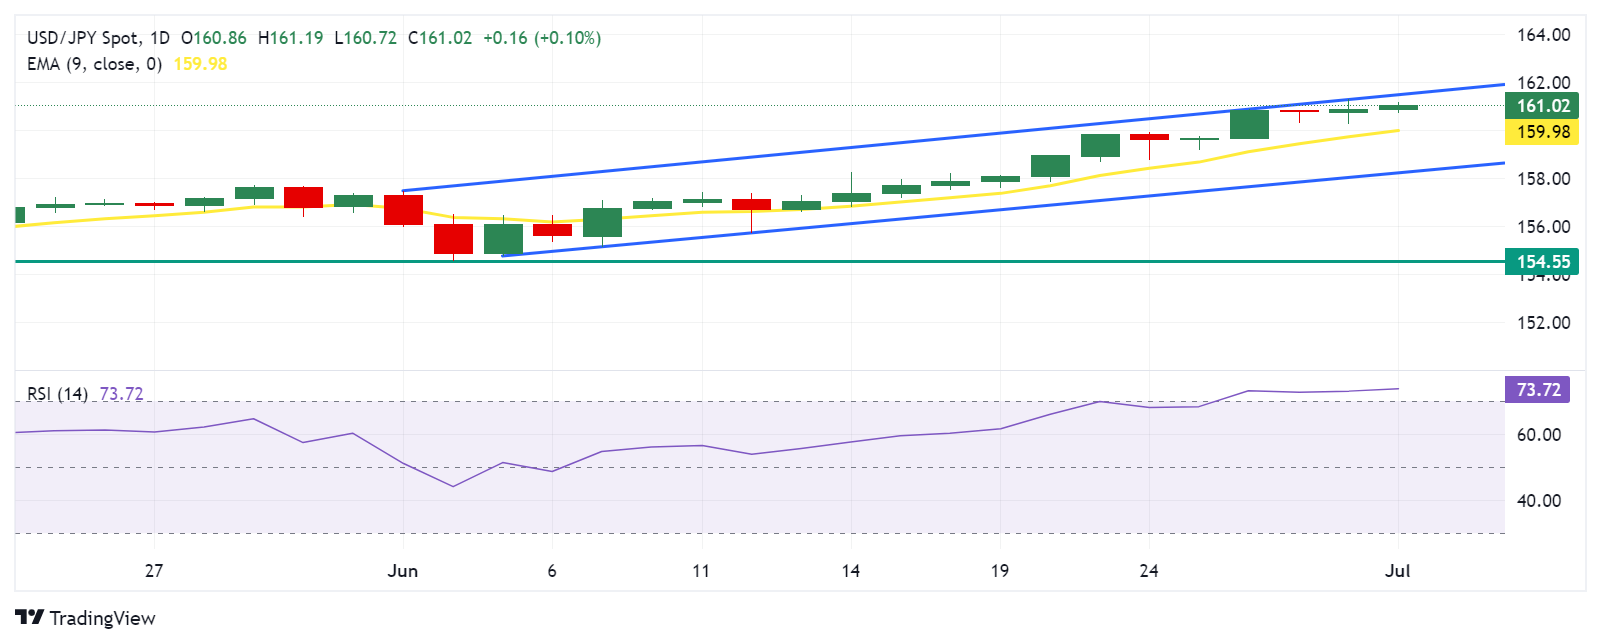
USD/JPY is trading near 161.00 on Monday. Analysis of the daily chart indicates a bullish trend as the pair is trading near the upper limit of an ascending channel pattern. The 14-day Relative Strength Index (RSI) is above the 50 level, indicating upward momentum.
A breakout of the upper limit of the ascending channel pattern around 161.50 will strengthen the bullish sentiment and the USD/JPY pair can move up towards the psychological level of 162.00.
On the downside, the immediate support is the 9-day exponential moving average (EMA) at 159.98. A breakdown below this level could intensify the downward pressure on the USD/JPY pair and push it down to the lower boundary of the ascending channel around 158.20. Below this level, the pair can retest the June lows at 154.55.
USD/JPY: Daily Chart
Today’s Japanese Yen Price
The table below shows the percentage change of the Japanese Yen (JPY) against the major listed currencies today. The Japanese Yen was the weakest against the Euro.
| USD | EUR | GBP | JPY | CAD | Australian Dollar | NZD | Swiss franc | |
|---|---|---|---|---|---|---|---|---|
| USD | -0.52% | -0.31% | 0.16% | -0.03% | -0.03% | -0.10% | 0.08% | |
| EUR | 0.52% | -0.01% | 0.40% | 0.18% | 0.38% | 0.12% | 0.29% | |
| GBP | 0.31% | 0.01% | 0.39% | 0.20% | 0.40% | 0.13% | 0.31% | |
| JPY | -0.16% | -0.40% | -0.39% | -0.20% | -0.13% | -0.26% | -0.07% | |
| CAD | 0.03% | -0.18% | -0.20% | 0.20% | 0.04% | -0.06% | 0.11% | |
| Australian Dollar | 0.03% | -0.38% | -0.40% | 0.13% | -0.04% | -0.26% | -0.01% | |
| NZD | 0.10% | -0.12% | -0.13% | 0.26% | 0.06% | 0.26% | 0.19% | |
| Swiss franc | -0.08% | -0.29% | -0.31% | 0.07% | -0.11% | 0.00% | -0.19% |
The heat map displays the percentage change between major currencies. The base currency is selected from the left column and the quote currency is selected from the top row. For example, if you select Japanese Yen from the left column and move it along the horizontal line to US Dollar, the percentage change displayed in the box will represent JPY (base)/USD (quote).