Plunging gasoline prices and falling prices in several other categories are pushing down overall CPI. It’s a big mess for the Bank of Canada.
Written by Wolf Richter of Wolf Street.
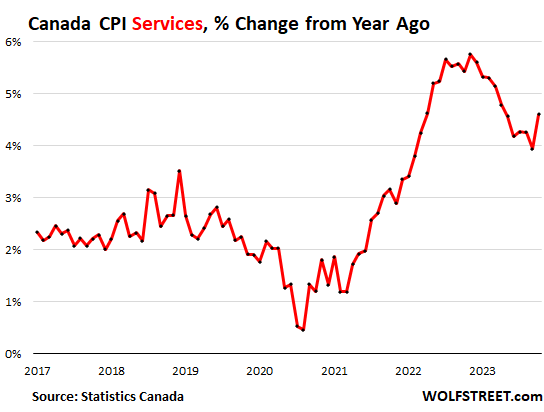
Statistics Canada announced today that Canada’s overall consumer price index slowed to +3.1% year-on-year in October due to a sharp drop in gasoline prices. Without gasoline, the rise would have been 3.6%, but only slightly slower than a month ago (3.7%). Food price increases have also slowed, remaining at a steep 5.4% year-on-year. However, the CPI for services accelerated to +4.6% year-on-year from 3.9% in September due to rising housing-related costs, including travel and rent.
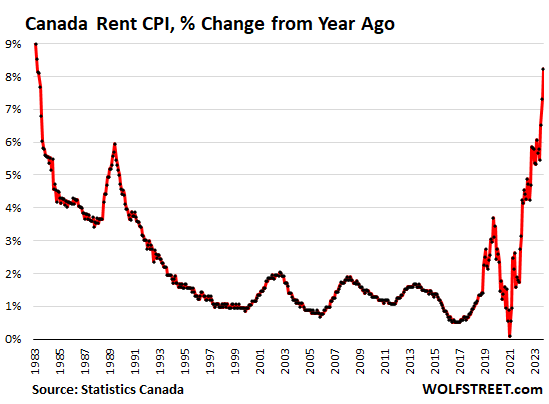
rent has risen explosively.
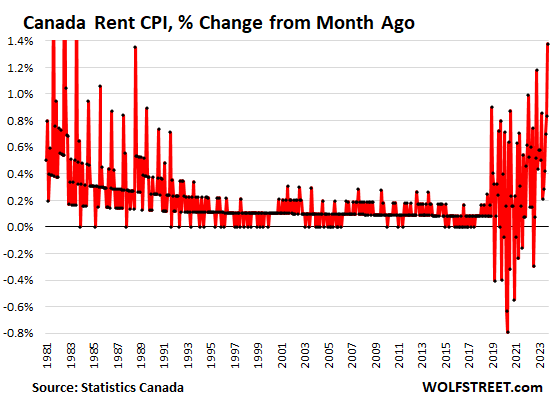
On a month-on-month basis, October’s rent CPI increased by 1.4% from September, and at an annual rate of 17.9%, marking the largest month-on-month increase in 40 years since August 1983. The data has become very volatile, but bigger than ever, and we can now see a pattern of unusual monthly spikes.
Compared to a year ago, rental CPI rose 8.2% in October, up from 7.3% in September and the largest year-over-year increase since April 1983.
Rent is not a discretionary item that people can easily waive if it’s too expensive. It’s a necessity, and it’s skyrocketing horribly, no match for wages or anything else. Rent inflation is a relentlessly worsening problem for Canadians.
The Bank of Canada notes that inflation in the housing sector is a major problem and one of the reasons for monetary tightening. Housing inflation, as measured by Canada’s CPI, has two major characteristics: rent and home ownership costs.
Before the BOC began tightening, it was pointing to inflation, which at the time was causing house prices to soar due to its own near-0% policy interest rate and massive quantitative easing. Currently, with the policy interest rate at 5%, housing prices have begun to fall seriously. Canada’s Greatest Housing Bubble: Prices are down to levels from two years ago, sales are plummeting, and supply is rising. But rents are moving in the opposite direction.
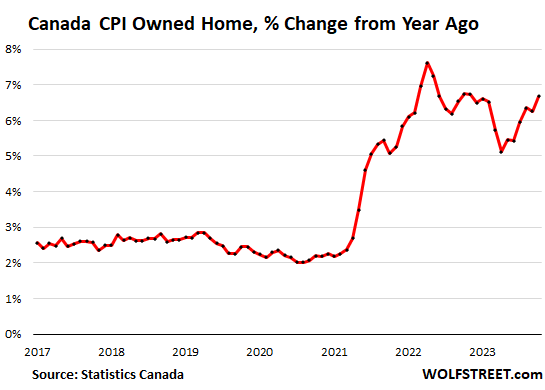
Homeowner CPI, Or “Owned Accommodations” jumped 1.04% month-on-month from September, or 13.2% annually in October.
Year-over-year, homeowner CPI accelerated to 6.7%, returning to last year’s level. This index includes the following items (% year-on-year), and note the services inflation aspect of this list:
- Mortgage interest cost: +30.5%;
- Replacement costs for homeowners (decrease in home prices): -1.2%.
- Property taxes and other special charges: +4.9%;
- Homeowner Home and Mortgage Insurance: +7.7%
- Homeowner maintenance and repairs. +3.5%;
- Other ownership accommodation expenses: 0.4%.
Service inflation skyrockets The month-over-month rate is 0.88% and the annualized rate is 11.1%. Compared to the same month last year, it accelerated again to 4.6%, returning to the May level.
The Bank of Canada has a complex problem. Across the CPI, plunging energy costs and slowing food costs, as well as lower inflation in several other categories, mask higher rents, housing-related costs, and overall services. The BOC has kept its main policy interest rate unchanged at 5.0% since July. Although the country is facing an economic slowdown, inflation in services, especially rents, is soaring.
Services inflation is part of the “underlying inflation” that the BOC continues to worry about. However, while it is politically difficult to raise interest rates beyond 5% when the overall CPI is 3.1% and the economy is slowing, the BOC has consistently kept the option of further rate hikes on the table.
historic immigration surge What is one of the reasons why rents, and housing costs more generally, have soared following the government’s decision to open the floodgates to immigration as a solution to everything?
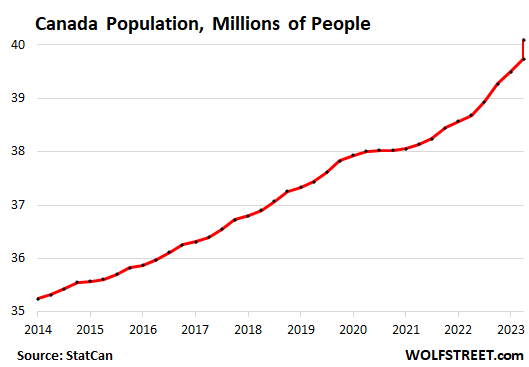
According to Statistics Canada, Canada’s population grew by 1.16 million people, or 2.1 per cent, over the past four quarters to 40.1 million in the third quarter, two to five times the year-ago growth rate. The influx of people into Canada needs housing, and most of them initially pursue rental properties, driving up demand at the lower end of the rent spectrum, and then moving up the upward ladder as rents skyrocket. This is another crazy graph, but it partially explains why rents are exploding even as home prices are falling.
Enjoy reading and supporting Wolf Street? You can donate. I appreciate it very much. Click on the beer and iced tea mugs to see how.

Would you like to receive email notifications when new articles are published on WOLFSTREET? Sign up here.
![]()